Home » Archives » Client Services
Client Services
Note: Click on the metric image to enlarge
Number of Help Desk Incidents and Requests
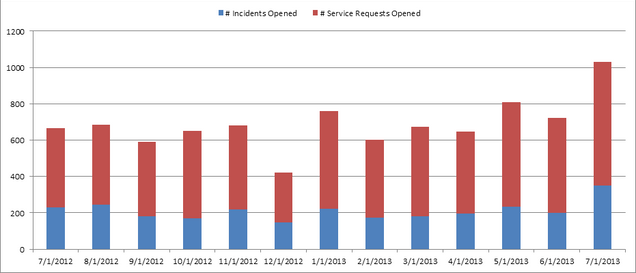
This graph illustrates the number of recorded Tickets by Month entered into our Service Management System.
Incidents are considered a broken computer or when something is not working
Service Requests are classified as issues like email account creation or computer installs
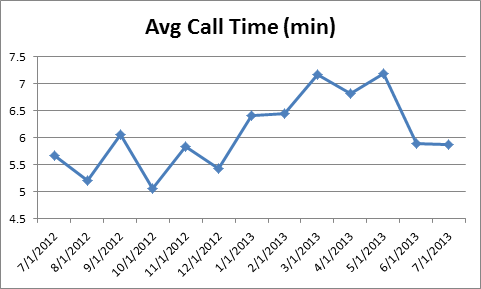
Average Call Time (Minutes)
This graph represents the average time a client is on the phone with a BUMC IT Service Desk Staff member when they call asking for help
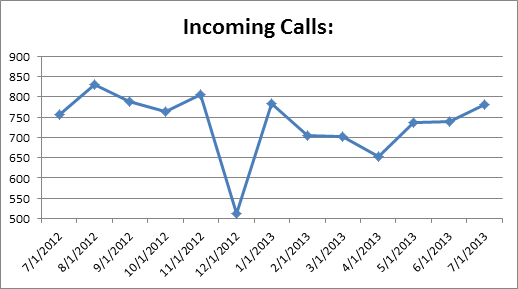
Total Incoming Calls
This illustrates the number of phone calls per month to the BUMC IT service desk number 617 638 5914
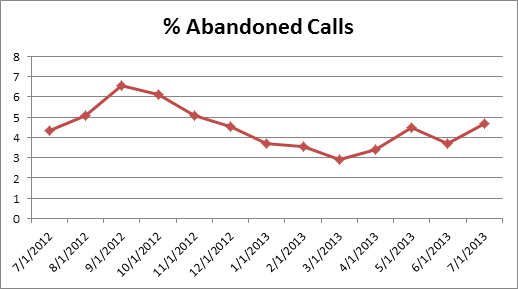
Percent Abandoned Calls by Month
Percentage of telephone calls abandoned by the caller while waiting to be answered
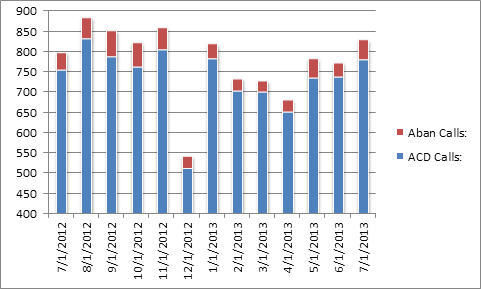
Total Calls
This graph represents the total number of calls that the BUMC IT Service Desk receives per month. The Red denotes the number of calls per month abandoned while waiting to be answered, the blue is the number of calls answered.
 Boston University | BU Medical Campus | About |
Service Management | Contact | Policies | Feedback | IT Request

