Centenarian Statistics
Para Español, presiona AQUÍ
[Updated January 1, 2023, Thomas Perls MD, MPH]
A Human Model of Exceptional Longevity and Aging Well

Centenarians (age 100+ years) markedly delay disability towards the end of their very long lives, at an average age of ~93 years (that’s 33 years beyond the age of 60!).1 Centenarians are models of aging well. Some of our subjects, ~15% have no clinically demonstrable disease at age 100 years and we call them “escapers”. About 43% are “delayers”, or subjects who did not exhibit an age related disease until age 80 years or later. Finally, there are about 42% of our subjects who are “survivors”, or those with clinically demonstrable disease(s) prior to the age of 80 years.
James Fries’ compression of morbidity hypothesis states that as one approaches the limits of lifespan, diseases (morbidity) must be delayed (or escaped) towards the end of lifespan. We have observed such compression amongst supercentenarians (age 110+ years), where health span indeed approximates lifespan. Thus, instead of the aging myth “the older you get the sicker you get”, it is much more the case of “the older you get, the healthier you’ve been”.
Demographics
According to data posted by the Population Division of the United Nations, in 2021 (https://population.un.org/wpp/Download/Standard/Population/):
- USA number of centenarians. Out of a US population of approximately 336,997,624, in 2021, there were 89,739 centenarians (age 100+) or a prevalence of 0.027%.
- The prevalence of centenarians has been increasing and in the past twenty years, the rate nearly doubled.
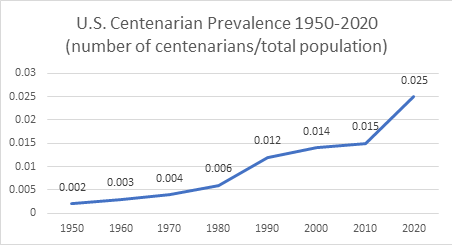
Perls T. US Centenarian Prevalence 1950-2020.
Derived from United Nations, Dept Economic and Social Affairs, Population Division (2022).
| Number of Nonagenarian (90-99 years) and Centenarian (100+) Social Security Beneficiaries according to State or Territory in 2019. |
| Rank | State or Territory | Nonagenarians | Centenarians | Total Population | Centenarian Prevalence | Per 10,000 | 1 per X population |
| 1 | Hawaii | 14,321 | 585 | 1,415,872 | 0.0413% | 4.1 | 2420.3 |
| 2 | Connecticut | 34,374 | 1,262 | 3,565,287 | 0.0354% | 3.5 | 2825.1 |
| 3 | Puerto Rico | 24,934 | 1,107 | 3,193,694 | 0.0347% | 3.5 | 2885.0 |
| 4 | Rhode Island | 10,333 | 359 | 1,059,361 | 0.0339% | 3.4 | 2950.9 |
| 5 | South Dakota | 7,565 | 298 | 884,659 | 0.0337% | 3.4 | 2968.7 |
| 6 | Iowa | 28,342 | 977 | 3,155,070 | 0.0310% | 3.1 | 3229.3 |
| 7 | North Dakota | 6,329 | 235 | 762,062 | 0.0308% | 3.1 | 3242.8 |
| 8 | New York | 153,488 | 5,780 | 19,453,561 | 0.0297% | 3.0 | 3365.7 |
| 9 | Massachusetts | 56,899 | 1,969 | 6,892,503 | 0.0286% | 2.9 | 3500.5 |
| 10 | Pennsylvania | 118,782 | 3,546 | 12,801,989 | 0.0277% | 2.8 | 3610.3 |
| 11 | New Jersey | 71,985 | 2,375 | 8,882,190 | 0.0267% | 2.7 | 3739.9 |
| 12 | Vermont | 5,226 | 166 | 623,989 | 0.0266% | 2.7 | 3759.0 |
| 13 | District of Columbia | 3,519 | 183 | 705,749 | 0.0259% | 2.6 | 3856.6 |
| 14 | Kansas | 22,182 | 744 | 2,913,314 | 0.0255% | 2.6 | 3915.7 |
| 15 | Maine | 11,427 | 336 | 1,344,212 | 0.0250% | 2.5 | 4000.6 |
| 16 | New Hampshire | 10,606 | 337 | 1,359,711 | 0.0248% | 2.5 | 4034.8 |
| 17 | Wisconsin | 47,615 | 1,434 | 5,822,434 | 0.0246% | 2.5 | 4060.3 |
| 18 | Minnesota | 41,914 | 1,376 | 5,639,632 | 0.0244% | 2.4 | 4098.6 |
| 19 | Illinois | 90,167 | 3,081 | 12,671,821 | 0.0243% | 2.4 | 4112.9 |
| 20 | Nebraska | 14,789 | 464 | 1,934,408 | 0.0240% | 2.4 | 4169.0 |
| 21 | Florida | 170,591 | 5,113 | 21,477,737 | 0.0238% | 2.4 | 4200.6 |
| 22 | Michigan | 76,815 | 2,261 | 9,986,857 | 0.0226% | 2.3 | 4417.0 |
| 23 | Ohio | 88,102 | 2,535 | 11,689,100 | 0.0217% | 2.2 | 4611.1 |
| 24 | Maryland | 37,965 | 1,305 | 6,045,680 | 0.0216% | 2.2 | 4632.7 |
| 25 | Missouri | 42,870 | 1,312 | 6,137,428 | 0.0214% | 2.1 | 4677.9 |
| 26 | Oregon | 30,218 | 895 | 4,217,737 | 0.0212% | 2.1 | 4712.6 |
| 27 | California | 232,707 | 8,012 | 39,512,223 | 0.0203% | 2.0 | 4931.6 |
| 28 | Indiana | 45,812 | 1,365 | 6,732,219 | 0.0203% | 2.0 | 4932.0 |
| 29 | Montana | 7,377 | 216 | 1,068,778 | 0.0202% | 2.0 | 4948.0 |
| 30 | Washington | 46,266 | 1,528 | 7,614,893 | 0.0201% | 2.0 | 4983.6 |
| 31 | Virginia | 50,799 | 1,572 | 8,535,519 | 0.0184% | 1.8 | 5429.7 |
| 32 | Arkansas | 17,992 | 553 | 3,017,804 | 0.0183% | 1.8 | 5457.2 |
| 33 | Delaware | 6,722 | 178 | 973,764 | 0.0183% | 1.8 | 5470.6 |
| 34 | South Carolina | 29,509 | 940 | 5,148,714 | 0.0183% | 1.8 | 5477.4 |
| 35 | West Virginia | 12,895 | 318 | 1,792,147 | 0.0177% | 1.8 | 5635.7 |
| 36 | Mississippi | 16,780 | 520 | 2,976,149 | 0.0175% | 1.7 | 5723.4 |
| 37 | North Carolina | 61,090 | 1,796 | 10,488,084 | 0.0171% | 1.7 | 5839.7 |
| 38 | New Mexico | 12,381 | 349 | 2,096,829 | 0.0166% | 1.7 | 6008.1 |
| 39 | Alabama | 28,122 | 793 | 4,903,185 | 0.0162% | 1.6 | 6183.1 |
| 40 | Idaho | 10,198 | 286 | 1,787,065 | 0.0160% | 1.6 | 6248.5 |
| 41 | Louisiana | 25,559 | 722 | 4,648,794 | 0.0155% | 1.6 | 6438.8 |
| 42 | Oklahoma | 22,973 | 614 | 3,956,971 | 0.0155% | 1.6 | 6444.6 |
| 43 | Wyoming | 3,429 | 89 | 578,759 | 0.0154% | 1.5 | 6502.9 |
| 44 | Arizona | 41,987 | 1,110 | 7,278,717 | 0.0152% | 1.5 | 6557.4 |
| 45 | Tennessee | 38,041 | 1,029 | 6,829,174 | 0.0151% | 1.5 | 6636.7 |
| 46 | Colorado | 29,326 | 855 | 5,758,736 | 0.0148% | 1.5 | 6735.4 |
| 47 | Kentucky | 25,346 | 632 | 4,467,673 | 0.0141% | 1.4 | 7069.1 |
| 48 | Georgia | 46,111 | 1,415 | 10,617,423 | 0.0133% | 1.3 | 7503.5 |
| 49 | Texas | 124,732 | 3,414 | 28,995,881 | 0.0118% | 1.2 | 8493.2 |
| 50 | Nevada | 12,796 | 356 | 3,080,156 | 0.0116% | 1.2 | 8652.1 |
| 51 | Utah | 12,258 | 271 | 3,205,958 | 0.0085% | 0.8 | 11830.1 |
| 52 | Alaska | 2,029 | 52 | 731,545 | 0.0071% | 0.7 | 14068.2 |
| All | 2,218,939 | 69,944 | 328,239,523 | 0.0213% | 2.1 | 4692.9 |
| Table created by Tom Perls MD (2023) from the following sources:
Total Population (2019) from: 2019 National and State Population Estimates, NST-EST2019-01: Table 1. URL: https://www.census.gov/newsroom/press-kits/2019/national-state-estimates.html Number of Nonagenarian and Centenarian SSA Beneficiaries from page 294 of: Annual Statistical |
Prevalence of centenarian age groups
Centenarians, Semi-Supercentenarians and Supercentenarians
The vast majority of centenarians are age 100 and the numbers and prevalence drop off dramatically with increasing age thereafter. Finding accurate tabulations of people at these older ages is challenging.
In Japan (the best case scenario with the highest prevalence of centenarians in the world) in 2015, when the total population was 127,250,933 (according to the UN Population Division), Yasu Saito, Futoshi Ishii and Jean-Marie Robine (Chapter 10, Exceptional Lifespans, Eds H Maier, B Jeune and JW Vaupel, 2021 https://link.springer.com/book/10.1007/978-3-030-49970-9) noted that there were 61,763 centenarians. Of these 57,847 (93.7%) were age 100-104, 3,770 (6.1%) were age 105-109 (semi-supercentenarians) and 146 (0.2%) were 110+ (supercentenarians). Therefore centenarians, age 100-104 occurred at a rate of 1 per 2,200 in the population, semi-supercentenarians at a rate of 1 per 34,000 and supercentenarians at a rate of 1 per 871,600 in the population.
In France, Ouellete, Mesle, Vallin and Robine reported that there were 28 supercentenarian deaths in 2016 (Chapter 9, Exceptional Lifespans, Eds H Maier, B Jeune and JW Vaupel, 2021 https://link.springer.com/book/10.1007/978-3-030-49970-9). Considering that the mortality rate of supercentenarians is about 50%, then one might estimate that there were 56 supercentenarians in 2016. According to the UN Population Division there were 63,989,319 people so the rate of supers was 1 per 1.1 million. The website, Liste de supercentenaires francais, on December 29, 2022 listed 33 alive supercentenarians and given a current overall population of 65,631,432, this would be a rate of 1 per 1.9 million.
Sex Differences
Eighty-five percent of centenarians are women and 15% are men. Among supercentenarians (110+), the female prevalence may increase to about 90%. Though women by far and away win the longevity marathon, paradoxically men are generally functionally better off and healthier. This may be because women handle age related diseases better (how they do this is not clear) whereas at these ages, the men are at higher risk of dying from them. Thus, the men who survive at these very old age have to be relatively healthier.
The reasons for why and how women so handedly win the longevity marathon are unclear. As to why, we subscribe several hypotheses. One has to do with antagonistic pleiotropy, the phenomenon where some biological processes that provide an evolutionary advantage at a young age, become a disadvantage at older age. In men, for example, testosterone promotes muscle strength, red blood cell production and strong bones. However, at older age, testosterone increases risk for blood clot formation and therefore atherosclerosis, heart disease, stroke and pulmonary embolism. Testosterone production is an example of what are likely numerous instances of antagonistic pleiotropy in men. Another hypothesis is that the evolutionary pressure to have as many offspring as possible (in order to increase the opportunity to pass one’s genes down to subsequent generations) drives the selection for genetic variants that slow aging especially of the female reproductive system and decrease risk for aging-related diseases that adversely impact upon female fertility and reproduction. These genes would not only impact the reproductive system but the rest of the body as well, thus enabling a longer life span. Many of these genes reside on the X chromosome of which women have two and men have one. In women one of the two X chromosomes is inactivated though there is evidence that having a choice between the two X’s, while men are stuck with the one they have, could lead to a survival advantage.
Percentage of a birth cohort that lives to 100 years old and to even greater ages
According to the 2018 CDC period life tables, in the US, 2.5% of white girls and 0.9% of white boys at birth will live to 100. For Blacks, it is 3.2% of girls and 1.1% of boys and for Hispanics it is 5.6% of girls and 2.2% of boys. Asian data are not provided by the CDC (this should be rectified!). Also, the percent that survive to even older ages, like 105 or even 110, is not provided by the CDC, something else we hope the CDC does in the near future.
There have been claims that 50% of French girls born today will live to 100. It is hard to imagine how this can be in light of what the current life table predicts based upon current age-specific mortality rates.
The U.S. Social Security Administration does provide actuarial life tables for ages above 100 but only by sex. They do not provide statistics according to ethnicity or race. The following table and graphs derived from the Social Security Administration’s 2019 life table (https://www.ssa.gov/OACT/STATS/table4c6.html)
| Age | Male | Out of 100,000 males born in 2019 |
Female | Out of 100,000 females born in 2019 |
| 100 | 1.07% | 1068 | 3.02% | 3021 |
| 101 | 0.70% | 696 | 2.11% | 2115 |
| 102 | 0.44% | 442 | 1.44% | 1443 |
| 103 | 0.27% | 272 | 0.96% | 957 |
| 104 | 0.16% | 163 | 0.62% | 615 |
| 105 | 0.09% | 94 | 0.38% | 382 |
| 106 | 0.05% | 52 | 0.23% | 229 |
| 107 | 0.03% | 28 | 0.13% | 132 |
| 108 | 0.01% | 14 | 0.07% | 72 |
| 109 | 0.007% | 7 | 0.04% | 38 |
| 110 | 0.003% | 3 | 0.02% | 19 |
| 111 | 0.001% | 1 | 0.009% | 9 |
| 112 | 0 | 0 | 0.004% | 4 |
| 113 | 0.001% | 1 | ||
| 114 | 0.001% | 1 | ||
| 115 | 0 | 0 |
Two important take-aways from the table and graphs are:
- Females fare much better than males in survival to age 100 and older. At birth, three times more girls (3%) than boys (1%) go on to live to 100. About 5 times more girls (0.23%) than boys (0.05%) live to 105 years and about 10 times more girls (0.02%) than boys (0.003%) live to 110.
- Rates of survival to 100 versus 105 versus 110 are very different. Three percent of females and 1% of males in the 2019 birth cohort, given age-specific mortality rates in that year, are projected to survive to 100 years old. Only 0.4% of females and 0.09% of males will survive to 105 years which is 10 times rarer than survival to 100. Survival to 110 years is 150 times rarer for females and 333 times rarer for males (0.02% for females, 0.003% for males) than living to 100. The percentage of survival for U.S. males and females, ages 100 to 114 years, are shown in Figure 1.
Research articles about centenarians usually do not account for the fact that these rarer and rarer ages likely entail very different underlying degrees of resilience or resistance to the various intrinsic and extrinsic causes of aging and aging’s predisposition to aging-related diseases. As a result, the predictors (e.g. biomarker and genetic signatures) and risk factors for what are different exceptional longevity phenotypes are different. One reason supercentenarians are so rare is that the corresponding combination of genetic and other biological determinants (signatures or networks) is so rare.
Realizing that these dramatically different rates of survival likely represent different phenotypes of exceptional longevity, the New England and Tokyo Centenarian Studies and the Japanese semi-supercentenarian study have, over the past decade, made concerted efforts to enroll and study semi-supercentenarians and supercentenarians. These studies have found that the majority of supercentenarians are escapers of aging related disease and disability at the age of 100. Furthermore, with approximately 70% of them being escapers they are a relatively homogeneous group compared to the heterogeneity observed among centenarians around age 100 years. When we initially attempted to prove Fries’ hypothesis, we were studying centenarians that were too young and only when we included participants with ages that approximated human lifespan did we find evidence in support of the compression of morbidity hypothesis.
See:
- Schoenhofen EA, Wyszynski DF, Andersen S, Pennington J, Young R, Terry DF, Perls TT. Characteristics of 32 supercentenarians. J Am Geriatr Soc. 2006 Aug;54(8):1237-40. PMCID: PMC2895458
- Andersen SL, Sebastiani P, Dworkis DA, Feldman L, Perls TT. Health span approximates life span among many supercentenarians: compression of morbidity at the approximate limit of life span. J Gerontol A Biol Sci Med Sci. 2012 Apr;67(4):395-405. PMCID: PMC3309876.)
- Yasumichi Arai, Hiroki Inagaki, Michiyo Takayama, Yukiko Abe, Yasuhiko Saito, Toru Takebayashi, Yasuyuki Gondo, Nobuyoshi Hirose, Physical Independence and Mortality at the Extreme Limit of Life Span: Supercentenarians Study in Japan, The Journals of Gerontology: Series A, Volume 69, Issue 4, April 2014, Pages 486–494, https://academic.oup.com/biomedgerontology/article/69/4/486/547861
What do Centenarians Die From?
In a study of death records from 8,559 centenarians in Denmark, during 2010-2012, died from the following (Kaalby L, Skytthe A, Andersen-Ranberf K, Jeune B, Chapter 8. Exceptional Lifespans, Eds H Maier, B Jeune and JW Vaupel, 2021 https://link.springer.com/book/10.1007/978-3-030-49970-9 )
- Cardiovascular and cerebrovascular disease 33%
- Pneumonia or other lung disease 12%,
- Cancer 4% (much lower than the rate in the 85-99 year old group which was 15%). In semi-supercentenarians the proportion who died from cancer was even lower, at 2.1%
- Gastrointestinal 3%
- Urogenital 2%
- Endocrine 3%
- Mental disease 7%
- Poorly defined 28%
- Accidents 3%
- Other 6%
Dr. Thomas Perls suspects that many of the “poorly defined” are dementia in addition to the 7% noted as mental disease. Though note that when dementia occurs in centenarians, it tends to be of very short duration.
In 2014, the CDC produced a report on centenarian mortality and indicated the top five causes were:
- Heart Disease
- Alzheimer’s disease
- Stroke
- Cancer
- Influenza and pneumonia
Nature Versus Nurture: The Role of Genes Versus Environment in Aging and Exceptional Longevity
Gerontologists often cite studies of lifespans amongst identical twins reared apart to describe the genetic and environmental components of aging. Based upon these studies, the common answer is 70-80% environment and 30-20% genes. This makes sense in the context of results from the study of Seventh Day Adventists at Loma Linda University who as a group have perhaps the longest average life expectancy in the United States, 86 years for men and 89 years for women. The main attributes that these individuals have in common is that their religion for the most part asks that they have very good lifestyle choices. That is, they tend to be vegetarian, they don’t smoke, they regularly exercise and hey spend a lot of time with their families and with their religion.
 Many Americans do the opposite (e.g. excessive meat consumption, lack of exercise, smoking, etc) and thus it is not surprising that on average, Americans die 8-10 years earlier. What the 7th Day Adventist results also show us is that the average American has the genes to reach their mid-late 80s, they just need to take very good care of themselves with proper lifestyle choices. Also note that the oldest subjects in the twin studies lived to their early to mid-eighties. Therefore, again, these findings indicate that health behavior choices explain the vast majority of our ability or inability to reach 86 years for men and 89 years for women.
However, we have learned from our studies of the siblings of centenarians and of supercentenarians that exceptional longevity runs very strongly in families. Also, a Danish study of nonagenarians and centenarians has noted that the power of an exceptional longevity (EL) study to discover genetic factors associated with EL increases with the age of the subjects. These and other study results strongly suggest that the genetic component of exceptional longevity gets larger and larger with increasing age and is especially high for those age 106 years and older.